
How climate zones are changing: why the hardiness map keeps moving
A hardiness zone looks like a fixed fact about a place. It is an average of the past thirty winters. As those winters warm, the zone lines move. That changes the risks you plan for when you choose long-lived plants.
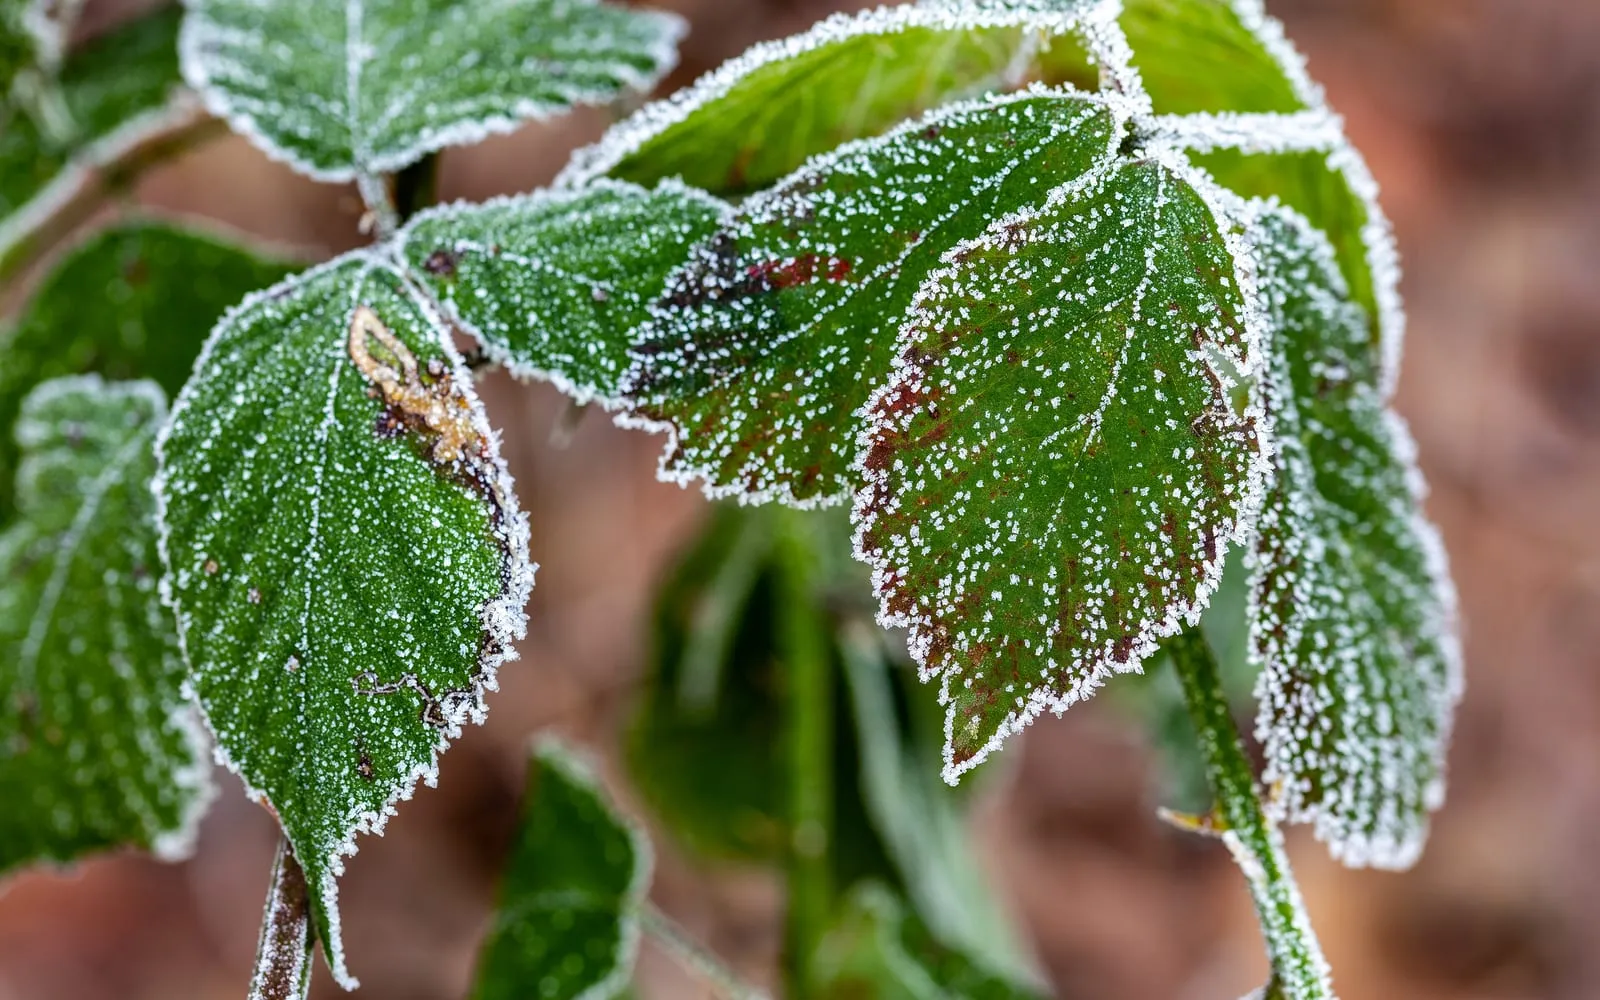
A hardiness zone can look like a permanent fact about a place. It is not. It is a thirty-year average of one number, the coldest night of the winter. As winters warm, that average changes. A seed packet printed for an older zone may describe winters that no longer match the ones your plants now face.
Two companion pieces give the wider context. Hardiness zones explained covers what the number leaves out, and gardening in a changing climate covers heat, drought, flooding, frost and pests. Hardiness zones have already moved far enough to change planting decisions.
The USDA map has moved three times
The United States Department of Agriculture drew its modern hardiness map in 1990, redrew it in 2012, and redrew it again in 2023. Each version sorts the country into bands ten Fahrenheit degrees wide, by the average annual extreme minimum temperature, and each version has been warmer than the one before.
The 2023 map shows the shift most clearly. It is about 2.5 Fahrenheit degrees warmer than the 2012 map, and roughly half of the United States moved into a warmer half-zone. A gardener may not have changed anything, but the label for their area still changed. In many places, an area that was zone 6b became zone 7a.
Warming and better data both matter
Not all of that movement comes from climate warming. The 2023 map used 13,412 weather stations, compared with 7,983 for the 2012 version. The newer map can show local cold pockets and warm city centres that the older map missed. Some changes come from better measurement rather than warmer winters.
The wider trend is still clear. The coldest nights are becoming less cold, which the IPCC reports as one of the better established signs of a warming world. Better instruments add local detail to that larger pattern.
RHS ratings are changing in practice
Gardeners in Europe often use the Royal Horticultural Society scale, H1 to H7, instead of USDA zones. The bands are fixed, each tied to a temperature range, so the scale itself does not change. The change is which band describes a garden in most winters. As winters warm, more gardens spend most years in a milder band. Plants rated at the edge of hardiness may survive winters that used to cut them back.
The wider climate is changing too
A hardiness zone tracks winter cold alone, but wider climate classifications are changing too. The Koppen-Geiger system classifies climates by temperature and rainfall together. Its projections show temperate and continental climates expanding towards the poles and into higher ground during this century, while hot dry regions widen. A garden near the edge of one climate type may fall into a different type within a working lifetime.
That wider shift matters because a zone change alone can mislead. A place can move a half-zone warmer in winter and become hotter and drier in summer at the same time. The hardiness number only says that the coldest night has become less cold.
A warmer zone still measures one night
Do not read a warmer zone as an easier garden. The zone still measures the one night that used to kill a plant, and nothing else. Two important changes are not shown on the map.
Late frost can become more damaging. A mild winter can start growth early, and a hard frost in spring can then hit soft new growth that a colder, steadier winter would have kept dormant. The risk comes from the swing rather than the average, and frost damage can happen later in the year as the first growth starts earlier.
Winter chill can also fall short. Many temperate fruit trees need a set number of cold hours before they flower well. An apple or a peach can sit in a warmer zone and still crop poorly if winter does not provide enough chill. A warmer zone can remove the cold that killed the tree while also removing some of the cold it needs to flower.
The lag a gardener plants into
A tree planted now will live through decades of changing winters. The zone that suits it at planting may not be the zone it grows old in. A short-lived bedding plant can be changed season by season, but an oak, a fig or an olive needs to suit the winters of the 2050s as well as the winters of today.
Milder winters help some tender plants. Plants that needed winter protection a generation ago now survive unaided in many gardens, and warm-climate fruit has a better chance in a longer, hotter summer. When you plant for the long term, use the current map as a starting point rather than as the final answer. The map is based on recent past winters, not future ones.
How to use a changing map
Start with the current zone, not an old one. The map in an old reference book or on an out-of-date label describes past winters. Check the latest USDA or RHS figure for where you are, and treat it as a winter survival floor that may keep rising.
Then plan for the range around it. A zone tells you the coldest night to expect. It does not tell you the hottest day, the longest dry spell or the late frost after a warm February. Those conditions matter more as the climate warms. Use the map as a recent snapshot, then choose plants for the warmer and less steady conditions they are likely to face.
Common questions
- Do hardiness zones change over time?
- Yes. A hardiness zone is an average of the coldest night each winter, taken over about thirty years. As winters warm, that average rises and the zone boundaries move towards the poles. The USDA has redrawn its map three times since 1990, and each revision has moved parts of the map into warmer zones.
- Why did my USDA hardiness zone change in 2023?
- The 2023 map used winter lows from 1991 to 2020, a warmer and better measured period than the one behind the 2012 map. It came out about 2.5 Fahrenheit degrees warmer overall, and roughly half of the United States shifted into a warmer half-zone. Part of the change is a milder run of winters and part is the far denser network of weather stations, 13,412 against 7,983.
- Is a warmer hardiness zone always useful for my garden?
- Not on its own. A warmer zone means less risk from the coldest night, so some tender plants become possible. It says nothing about summer heat, drought, rainfall or the late frosts that a mild winter can make more damaging. A zone is a floor under winter survival, not a description of the whole growing year.
- Do RHS hardiness ratings change as the climate warms?
- The ratings themselves are fixed bands, from H1 to H7, each tied to a temperature range. What changes is which band a place sits in. As winters warm, more gardens spend most years in a milder band than they did a few decades ago, which is why some plants once cut back by winter now come through it.
Sources and further reading
- USDA Plant Hardiness Zone MapUnited States Department of Agriculture, Agricultural Research Service, 2023The 2023 map, built from the average annual extreme minimum temperature for 1991 to 2020.
- USDA unveils updated Plant Hardiness Zone MapUSDA Agricultural Research Service, November 2023About 2.5 Fahrenheit degrees warmer than 2012, with roughly half the country a half-zone warmer, from 13,412 stations against 7,983.
- RHS Gardening in a Changing Climate reportRoyal Horticultural Society, 2017RHS guidance on gardening as winters warm and weather becomes less steady.
- AR6 Synthesis Report: Climate Change 2023Intergovernmental Panel on Climate Change. IPCC, 2023Observed warming and the decline in cold extremes behind shifting zones.
- Present and future Koppen-Geiger climate classification maps at 1-km resolutionHylke E. Beck and others. Scientific Data, 2018Projections of how the wider climate types move poleward and upslope during this century.
- Climate change impacts on winter chill for temperate fruit and nut productionEike Luedeling. Scientia Horticulturae, 2012Why a warmer winter can leave a fruit tree short of the chill it needs to flower.