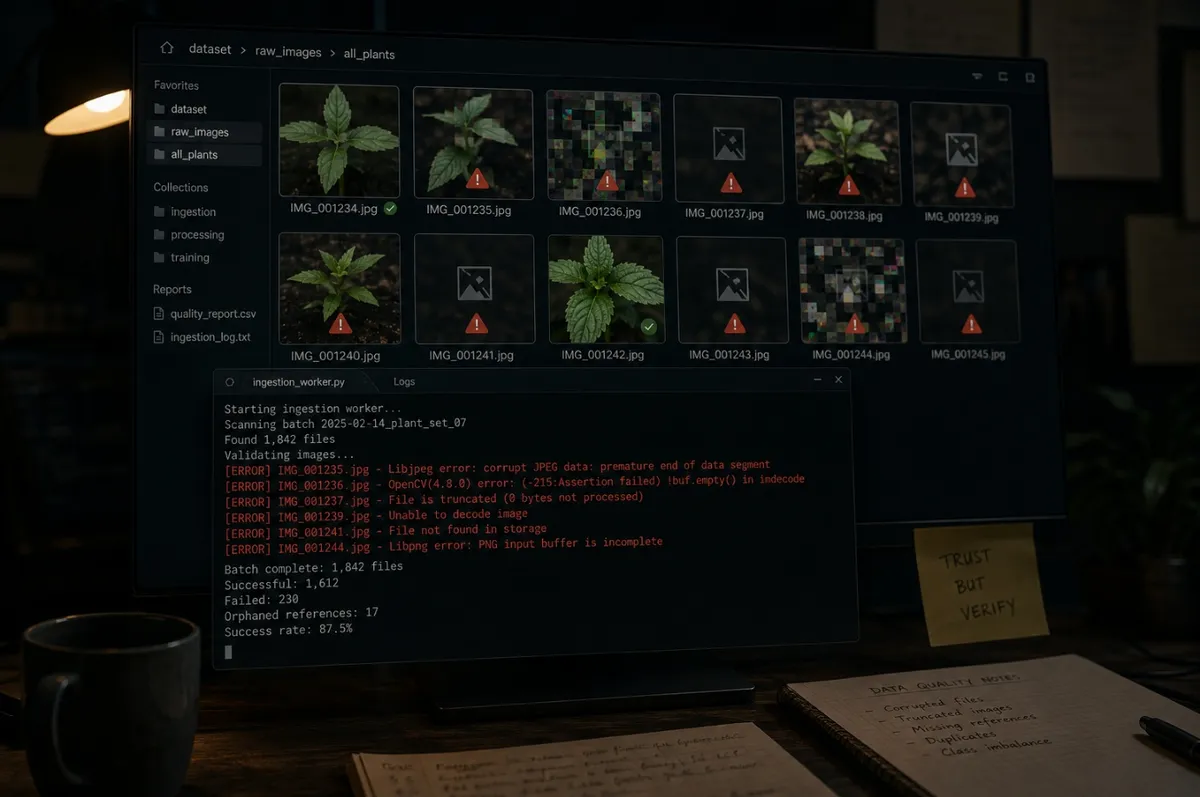
The third image wouldn’t open either.
The training run had already died once. I reran it, thinking it was a transient issue, maybe CUDA, maybe memory. But then I stepped through it batch by batch, isolating the failure.
First image: fine.
Second: fine.
Third: corrupt.
I pulled the file directly. It existed. It just wouldn’t decode. I tried another. Same thing. Another loaded, but threw an error halfway through. Another was zero bytes.
This wasn’t one bad file.
It was the dataset.
Two days earlier, everything had looked like it was working.
I had a full pipeline running end to end: collection, storage, training. I could kick off a run and watch it progress. Loss going down, metrics updating, batches flowing.
At one point, I had a run complete cleanly. No crashes. Predictions coming out the other side. It wasn’t perfect, but it looked real.
So the next step was obvious: add more data.
The crashes were just the most visible problem.
Once I started looking at the dataset itself, other issues surfaced quickly.
First: corrupted files.
Twenty-five of them, scattered across the dataset. Files that existed in the database but couldn’t be opened. Files that partially decoded and then failed. Three more were referenced in the database but missing on disk entirely. Orphans, pointing at files that had been deleted somewhere along the line. Most of the corruption came from collection-time write errors, where a download had been interrupted or a file had been written incompletely. Training runs had been quietly hitting these files for days and crashing. None of the failure messages had said the word corrupt. They had all said CUDA.
There was nothing to train around. The system just stopped.
Then: duplicates.
I started inspecting the dataset manually, folder by folder. It wasn’t a sophisticated diagnostic. I was opening directories and scrolling through thumbnails.
One species looked well represented. Dozens of images. But scrolling through them, something felt off. The same image appeared again. And again. Sometimes identical, sometimes resized, sometimes slightly compressed, but clearly the same original.
I checked more species. Same pattern.
That afternoon I wrote a perceptual hash check. It compares images and flags those that are visually identical even when they’ve been resized, recompressed, or saved in different formats.
It was systemic. Around 24% of the dataset was repeated content.
The cause was straightforward once I traced it. Multi-phase collection had been pulling the same images from different sources, sometimes pulling the same image twice from the same source in different runs, and nothing in the pipeline had been checking. The dataset hadn’t been growing. It had been duplicating.
What looked like scale was, mostly, copies.
Then: imbalance.
I ran a class distribution check.
At first glance, it looked uneven but manageable. Some species had more images than others. Expected for scraped data.
Then I actually measured it.
The ratio came out at 68:1 across 33 species. The most represented species had 68 times more images than the least.
I reran the numbers. Same result.
I picked one of the least represented species and checked its predictions. The model didn’t recognise it. It didn’t even try. It defaulted to one of the dominant classes. The ones it had seen the most.
Every time.
It wasn’t learning the space of plants. It was learning the frequency of my dataset.
This wasn’t just the pipeline breaking. The data didn’t behave like training data.
At this point, the system wasn’t even getting to the point where the model mattered.
I spent the rest of the week on a four-stage cleanup. Remove the bad files. Deduplicate the rest with the perceptual hash check. Generate synthetic images to balance the under-represented classes. Re-score everything for quality.
By the end of the week, the dataset was clean. The imbalance was down to 4:1. The training pipeline ran without crashing.
None of this was a model problem.
A larger model wouldn’t have fixed any of this. It would have made it harder to see. A more powerful model would have memorised the 438 duplicates more confidently. It would have learned the 68:1 frequency bias more sharply. It would have produced predictions that looked more authoritative and were no more correct. The failures weren’t in the architecture. They were in the data, and in the system around it.
Before the model could improve, the system had to.
The first thing that broke wasn’t the model.
It was the data.
What came next wasn’t a simple fix.
To be continued.