
The first real model finished training in the middle of February. 42.7% top-1 accuracy on 2,592 species. 66.1% top-5. The numbers were carefully logged, version-controlled, and clearly below anything I could ship.
That was the point where the first climb ended. I had a real training run, a real model, and a real answer: not yet, and not like this. I was no longer at the start, but the way out was still a long way above me.
Why the data was the ceiling
The model wasn’t overfitting. The train-val gap was narrow, about a percentage point, which is healthy. It wasn’t underfitting in the way that usually means a capacity problem. EfficientNet-B0 was a standard choice for this class of task, the loss curves behaved, and the optimiser converged.
The result meant the model had learned everything the data could teach it, and the data couldn’t teach it enough.
This wasn’t surprising once I looked at it clearly. The dataset was around 150,000 images across 2,592 species, about 58 images per class on average, with a long tail. Many species had under thirty images. Some had under ten.
So what does 42.7% mean here? It does not mean the model is stupid. It means the model has run out of useful evidence. If a species has ten poor photographs, the model cannot learn how that species looks in every season, from every angle, and in every kind of light.
For fine-grained visual classification, where the model has to tell one sage from another, thirty images per class is nowhere near enough. You can train a model on that, and it will train cleanly, and it will produce loss curves that look healthy. It won’t generalise, because it hasn’t seen enough variation to know what variation means for any given species.
The bottleneck was upstream of the architecture and the training loop. It was data.
I had thought I was done with data problems months before.
The gamble
The safer path would have been to fix the model at 2,500 species first. I should have got it to a place where I knew the approach worked, understood what was limiting it, and only then scaled up with the smaller version known good.
I didn’t do that. I couldn’t.
The mobile app was being built in parallel. The mobile side needed a species contract, a list of exactly which plants the app could identify, with stable IDs that the mobile database could be built around. A contract that could be changed later wasn’t a contract. The app couldn’t ship with a database that might need to be reindexed because I’d decided to add or remove species after integration had started.
The list had to be frozen, it had to be frozen soon, and it had to be frozen at the right size. The right size wasn’t 2,500. The app was for gardeners and houseplant owners, not specialists, so it needed to cover the plants those users were actually likely to photograph. That was 5,000 species, give or take. Not the world of plants. Just the world of garden plants and houseplants.
So on 20 February I doubled the class count on a model that wasn’t working. I hadn’t fixed the 2,500-species version. I didn’t know whether the problems I was seeing at 2,500 were caused by class count or by something else entirely. I was going to find out at 5,000.
It was the largest gamble I’d taken on the project. The conventional engineering move is to get the small version working before adding complexity. I was going the other way because the mobile timeline needed the contract, and the contract needed to be 5,000 species. If the model couldn’t handle 5,000 species, I wasn’t going to find out with a clean exit. I’d find out after the mobile project had built an app around a database I could no longer change.
That decision turned the stage gate into an all-or-nothing bet. If the 5,000-species model couldn’t clear the accuracy threshold I’d set in January, the project was done. There was no fallback to a smaller version of the same work. The smaller scope was what I was leaving behind. Either 5,000 species worked, or I’d told myself I’d stop.
I froze the list. I committed it to the mobile repo as a contract. Then I started the work of making the data good enough to support the decision I’d just made.
That is what a product constraint does. It rules out some technically sensible options because they do not serve the product you are building. A smaller identifier might have been easier to train, but it would not have answered the user’s question often enough to justify the app.
The valley
From 20 February to 27 March, the work was grinding.
The collection pipeline that had been built for 2,500 species at moderate depth now needed to scale to 5,000 species at greater depth. Every species in the frozen list needed a target number of images, and the long tail was where the problems lived.
Common species were easy. Tomato, basil, and rosemary had tens of thousands of public-domain photographs available. The tail was harder. Some species were grown by gardeners but not extensively documented online. Some had taxonomic synonyms that scattered images across multiple names. Some existed in the databases but nowhere in the public image record.
I rebuilt the collection pipeline three times over eleven days in March. Each version ran, closed some species, and exposed the next blocker. The pattern became familiar. Deploy the new version, watch which species closed, investigate the ones that hadn’t, find the reason, write a fix, deploy again.
Most of the reasons weren’t what I expected. I kept assuming the persistent tail was genuinely rare species, plants with few images because they had few images. That was a data scarcity problem I couldn’t solve by writing better code.
That assumption turned out to be wrong four times out of five. The tail was mostly code bugs in my own collectors. One quality preset had the strict setting less strict than the balanced setting because I had inverted the thresholds. One shared collection budget let the first source consume the whole quota before the other sources got a chance. One collector wasn’t receiving common names, so it searched only for the Latin binomial on a platform where most uploads use common names.
Each of these was a bug I could fix. Each of them had been silently losing images for species I’d assumed were rare.
Somewhere in the middle of this, out of frustration, I wrote down the rule I kept failing to follow. Never assume species are rare; investigate the collector code first. I had to relearn that three or four times before it stuck.
AI tools couldn’t help me much here. The bugs were in code I’d written in places I hadn’t audited. The fix in every case was specific to my own implementation choices. This was still solo work, just narrower and less romantic than the version I’d imagined.
This is one of those lessons that sounds obvious afterwards. When a pipeline under-collects, it is tempting to assume the outside world has no data. Sometimes that is true. Often the better first check is the collector code. Find out whether the pipeline is missing data before deciding the data does not exist.
I was paying for most of this out of my own pocket. The rule I’d set in the beginning was now showing up as line items on my bank statements. Use open licences. Respect terms of service. Pay when paying is the right model.
PlantCLEF access. iNaturalist API keys. Flickr subscription. By late March I added another paid image search. The long tail of rare species needed more searches than any single provider allowed. The spending wasn’t dramatic, in the hundreds of pounds total across the whole project. But it was all coming out of my own bank account, and the rule I’d set was what required it.
I was building something I’d be willing to put my name on. This was what that cost.
Somewhere in the middle of March I made a concession I wasn’t happy with. The truly rare species, plants with twenty or thirty usable images on the entire internet, couldn’t meet the 640-pixel minimum I’d set for image quality. Higher resolution would have been better for training. Higher resolution didn’t exist for these species. I dropped the minimum to 260 pixels to get any images at all. The trade was clear: smaller, lower-quality images that the model could at least see, versus no training data at all and the species getting silently dropped from the app. The 260-pixel images weren’t good. They were better than nothing, and nothing was the alternative.
The days during this stretch were uniform. Most mornings I’d check the collection dashboard to see how many species had closed overnight, find it was fewer than I’d hoped, investigate the ones that hadn’t, write a patch, deploy, wait. Most evenings I’d do the same.
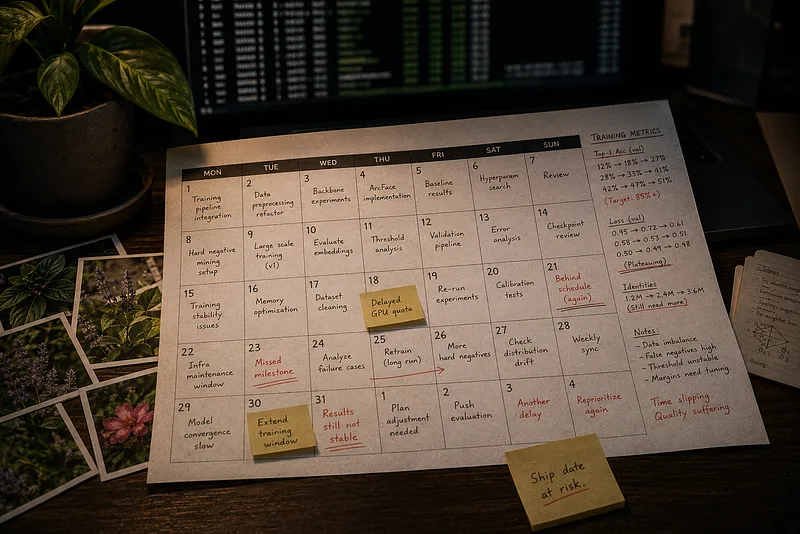
The calendar was on my desk. I had printed it in January, when I’d written the roadmap. Every task mapped to the day it was meant to close, the whole plan laid out on sheets of paper. It wasn’t a schedule suggestion. It was the committed timeline, the one I’d held myself to. Every morning I could see what day it was, and what day the calendar said I should be on, and the gap between them.
The gap grew every week. One task slipped by a day. Another slipped by two. A planned week of collector work turned into ten days, then twelve. By mid-March the calendar said I should have been training the model for a fortnight. I was still fixing collectors.
I was in the valley now. The first climb had got me to a real model, but the final climb was still 75% accuracy on 5,000 species, and I couldn’t yet see the route out. The doubts cycled in and out. Some days they were quieter. Some days they were loud. I never crossed into wanting to give up, but there were days when I couldn’t tell whether the work I was doing was going to get me there, or whether it was just a slower version of being stuck.
What kept me walking
The plan.
For two weeks in January I had stopped building and started planning. At the time, the planning felt like the thing I had to do instead of making progress. In March it was the only reason I was still moving.
Every task had acceptance criteria. Every acceptance criterion had a specific, bounded meaning. When a task was done, I knew it was done. When a task wasn’t done, I knew what was missing. The planning I’d done in January wasn’t producing progress directly, but it told me where I was.
I wasn’t lost. I was slower than I wanted to be, and those are not the same thing. Lost is when you stop because you don’t know where to go. Slow is when you keep walking because you know where the next marker is.
The calendar on my desk made that visible. The gap between where I was and where I should have been was painful to look at every day, but it also told me the destination hadn’t moved. The plan hadn’t broken. I was behind on it, but I was still on it.
The stage gate hadn’t moved either. The deadline I’d written in January was still on the calendar. Each week in the valley was a week I wasn’t spending on training, and the final climb was getting closer. It was pressure, not panic. The plan was still good; I was still below the ridge line; the gate was still out there.
The ceiling
By the end of March the data work was closing. It was not finished. I don’t think the data work was ever finished, but most species were hitting their image targets. The collection pipelines had stabilised. The bugs had slowed from a daily occurrence to a weekly one.
The dataset had grown more than thirty times in size from where it had been before the freeze, and the average image count per species had climbed to 1,000 images. That was a range where I could plausibly ask a model to learn from it.
I told myself the data was as good as I was going to get it. I wasn’t sure. What I was sure of was that I was out of things to do on the collection side that would meaningfully move the needle. The question now was whether the model architecture and the training approach could make use of what I’d built.
I didn’t know the answer to that yet.
To be continued.